Monday, 16 June 2014

Basic Laboratory Orientation

The first time in the school lab was an eye-opener for me. The lab was big and well ventilated and had a wide range of items that were totally alien to me. I learnt about many laboratory apparatus that I had never seen before, such as the pipette and burette. I also learnt about the rules and regulations in the lab and what I must do when an accident occurs.


Here are some examples of what to do when an accident occurs.

1. What should you do if you accidentally spilled some strong acid onto your skin?
Answer: Wash it thoroughly with plenty of water.

2. David poured 30cm^3 of acid into a beaker from a container meant for the entire class. He only used 20cm^3. What should he do with the excess acid?
Answer: He should pour the excess acid into a special bottle meant for disposal as instructed by his teacher. Warning! Do not pour it into the dustbin as it requires special disposal methods and is also dangerous for other lab users.

3. Why is it dangerous to leave a non-luminous flame unattended?
Answer: A non-luminous flame can hardly be seen and may cause others to burn themselves accidentally.

Here is a picture showing you some basic lab apparatus.


One interesting thing I learnt in the lab is how to light a Bunsen burner.
 
The best way to light a Bunsen burner would be to close the air-hole, turn on the gas tap slowly and ignite a lighter near the mouth of the barrel.
 
Here is the picture of a Bunsen burner with its parts labelled.

Here is a video on how to light a Bunsen burner.

When the air inlet of the Bunsen burner is closed, you get a luminous flame.
When the air inlet of the Bunsen burner is opened, you get a non-luminous flame.

What are the differences between a luminous and non-luminous flame?

Firstly, the flame of the luminous flame is unsteady whereas the flame of the non-luminous flame is steady.

Secondly, the luminous flame can be seen from a distance but the non-luminous flame cannot be seen from a distance.

Thirdly, the luminous flame is not as hot as the non-luminous flame, which means that the non-luminous flame is hotter than the luminous flame.

Why does a "strike-back" occur when the air holes are fully opened?
Answer: When the air-holes are fully opened, a large supply of air enters and the gas burns at the jet instead of the mouth of the barrel, causing a "strike-back".


Thank you for reading!
References from Wikipedia, Google and Youtube.

Graphs

Hi everyone, today I will be making a new post about graphs.

What are the applications of graphs?
"Graphs can be used to model many types of relations and processes in physical, biological, social and information systems. Many practical problems can be represented by graphs.

In computer science, graphs are used to represent networks of communication, data organization, computational devices, the flow of computation, etc. For instance, the link structure of a website can be represented by a directed graph, in which the vertices represent web pages and directed edges represent links from one page to another. A similar approach can be taken to problems in travel, biology, computer chip design, and many other fields."

Personally, I feel that graphs are very effective and useful in a sense that they help to categorise information very neatly for further manipulation.

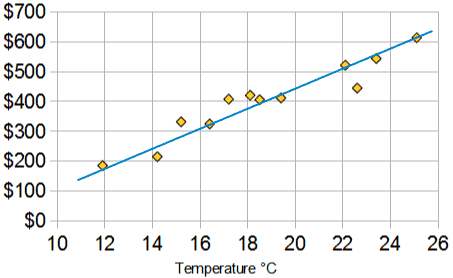
Basically, we are taught two types of graphs by our Science teacher, Mr Tan. They are the straight line graph and the smooth curve graph. For the straight line graph, we can either simply link the points on the graph together to form a straight line or we can draw a line of best fit. the line of best fit is a line on a graph showing the general direction that a group of points seem to be heading. Here is an example:
 
As you can see, the person is drawing the graph in the direction where all the points seem to be heading. All the points also have to be near to the line and not too far away. The line may pass through some or none of the points. Here is a video showing you how to draw the line of best fit. Enjoy!


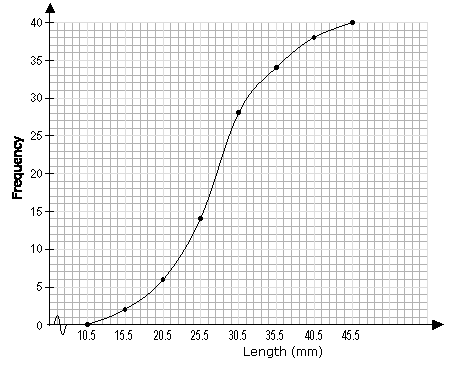
The other type of graph is the smooth curve graph. Drawing a smooth curve graph is relatively easy considered to the line of best fit. You just have to make sure your curve is smooth and connects all the dots together. There is another graph known as the best-fit curve. It is almost the same as the line of best fit just that it is curved. You can use a flexi ruler to help you out. Here is an example of a smooth curve graph:
When we draw graphs, we also have to understand something called the axis.
 
What is an axis?
An axis is a "a fixed reference line for the measurement of coordinates."
There are two types of axes, the horizontal and the vertical. It is known as the x and y axis respectively.
The x axis is the independent variable whereas the y axis is the dependent variable.
"the variable that is thought of as a cause is placed on the horizontal axis, and the variable that is thought of as an effect on the vertical axis".
 
What are variables?
A variable is "a quantity which during a calculation is assumed to vary or be capable of varying in value."
 
What is Interpolation and Extrapolation?
 
INTERPOLATION is a method used to approximate values that are in between points of a graph.
 
EXTRAPOLATION is a method for approximating values that are beyond the range of the data. Data must be extrapolated when values needed are not in the range of the measurements obtained. 
 
 Well, a graph is supposed to show the relationship between variable quantities on the x and y axis. Now you know if you've drawn a good graph!
 
References from Google, Wikipedia and Youtube.
 
Thank you for reading!


Science and Technology

Hi guys, today I will be making a new blog post about Science and Technology.

What is Science and Technology?
Well, "Science and technology is a term of art used to encompass the relationship between science human and technology. It frequently appears within titles of academic disciplines (science and technology studies) and government office."

What are the advantages of Science and Technology?
The advances in Science and Technology show people a more efficient way to do things and these processes get results.

What is the difference between Science and Technology?
Science is the study of things in the world whereas Technology is the application of this Scientific knowledge. It deals with the creation and development of things.

However, there are also disadvantages of Technology. People have become more dependent on technology and when a machine or computer spoils humans becomes almost disabled.

There are also many limitations of Science. There are some things that are just unsuited for Science such as Science doesn't make moral judgments and Science can predict disasters but not stop it.

Some people also abuse Scientific applications by manufacturing pure samples of heroin for consumption.

The invention of light bulbs is an example of technology.

Now, I will be showing you some videos on the examples of technology. Enjoy!

 
References and videos from Wikipedia and Youtube respectively.


Monday, 3 March 2014

Awesome videos

Hi guys, so I was searching for fun and interactive science videos when I found this Youtuber. His videos are really cool and interesting and will definitely pique your curiosity. You'll soon know why. Here are some videos made by him. To find out more, simply click here>Asap science.

Video #1: The Poop Cycle
Video #2: How old are your ears?

Video #3:  Are silent fats worse?

Video #4:  Why are Olympic records always broken?
Video #5:  The most horrifying parasites!

Interesting?
VERY

Physical quantites and units

Hi guys, today I will be posting about physical quantities and SI units.

You must be wondering, what is a physical quantity?

Well, "physical quantity (or "physical magnitude") is a physical property of a phenomenon body, or substance, that can be quantified by measurement".

"Most physical quantities include a unit, but not all - some are dimensionless. Neither the name of a physical quantity, nor the symbol used to denote it, implies a particular choice of unit, though SI units are usually preferred and assumed today due to their ease of use and all-round applicability. For example, a quantity of mass might be represented by the symbol m, and could be expressed in the units kilograms (kg), pounds (lb), or daltons (Da)."

These are the base quantities:

What are SI units?
"The International System of Units (abbreviated SI from FrenchLe Système international d'unités) is the modern form of the metric system and is the world's most widely used system of measurement, used in both everyday commerce and science. It comprises a coherent system of units of measurement built around seven base units, 22 named and an indeterminate number of unnamed coherent derived units, and a set of prefixes that act as decimal-based multipliers."

Here are some prefixes:
So, how do we convert units? Watch the video below to find out more!


Thanks for viewing!
Pictures and videos from google and youtube respectively
Some information from wikipedia


Monday, 17 February 2014

Significant figures and decimal points

This new blog post is on Significant numbers I had learnt a week ago.

What defines a S.F.?
" The significant figures of a number are those digits that carry meaning contributing to its decision".

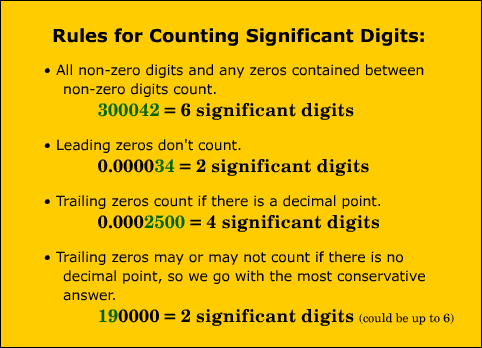
There are basic ground rules for S.F.s
1.Digits with no zeros are always significant. Example: 2.4 (2 s.f.), 5281 (4 s.f.)
2.All zeros after the decimal point are significant. Example: 0.500 (3 s.f.), 4.0 (2 s.f.)
3. Zeros that are in between two other significant digits are significant. Example: 7.06 (3 s.f.), 10.09 (4 s.f.)
4. Zeros used only for spacing decimal points are not significant.Example: 0.003 (1 s.f.), 0.020 (2 s.f.)

Calculation of physical data
1. Addition and subtraction: The final value has the same number of decimal places/ place value as the least precise measurement. Example: 44.1 + 8.002 + 0.93 = 53.0(1 d.p.)
                                  (1 d.p.) (3 d.p.) (2 d.p.) 
2.Multiplication and division: The product/quotient has the same number of significant figures as the number with the least number of significant figures. Example: 21.3 X 9.800 = 209    / 100.2  ÷   0.50 = 2.0 X 100 
                                                                           (3 s.f.)    (4 s.f.)   (3 s.f.)  (4 s.f.)       (2 s.f.)  ( 2 s.f.    )
3.Average: The final value has the same number of decimal place/ place value as the least precise measurement 
                 Example: velocity = (45.0 + 48.21 + 47.024) ÷ 3 = 46.7 km/h (1 d.p.)
                                               (1 d.p.) (2 d.p.) (3 d.p.)
4.Constant: The number of decimal place / place value of a constant is not calculated in a calculation
                   Example: 0.5 m v2 = 0.5 X 1.55 X 2.0 X 2.0= 3.1 J (2 s.f.)
                                                             (3 s.f.)  ( 2 s.f./ squared)
NOTE: 120( 3 place values) 
            120 has lesser precise measurement than 121.123

images and videos from google and youtube respectively

Tuesday, 4 February 2014

Home

Hello everyone! My name Ho Yoong Kwan. I study in Hwa Chong Institution and my class and register number is 1i3 and 8 respectively. This blog is to recap on what I have learnt in school and to share interactive videos and constructive information with everyone. I hope you will read and hopefully enjoy my blog.