What are the applications of graphs?
"Graphs can be used to model many types of relations and processes in physical, biological, social and information systems. Many practical problems can be represented by graphs.
In computer science, graphs are used to represent networks of communication, data organization, computational devices, the flow of computation, etc. For instance, the link structure of a website can be represented by a directed graph, in which the vertices represent web pages and directed edges represent links from one page to another. A similar approach can be taken to problems in travel, biology, computer chip design, and many other fields."
Personally, I feel that graphs are very effective and useful in a sense that they help to categorise information very neatly for further manipulation.
Basically, we are taught two types of graphs by our Science teacher, Mr Tan. They are the straight line graph and the smooth curve graph. For the straight line graph, we can either simply link the points on the graph together to form a straight line or we can draw a line of best fit. the line of best fit is a line on a graph showing the general direction that a group of points seem to be heading. Here is an example:
As you can see, the person is drawing the graph in the direction where all the points seem to be heading. All the points also have to be near to the line and not too far away. The line may pass through some or none of the points. Here is a video showing you how to draw the line of best fit. Enjoy!
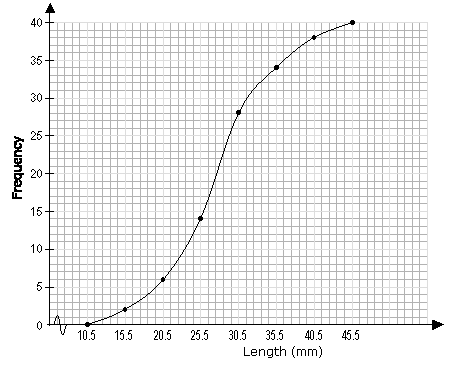
The other type of graph is the smooth curve graph. Drawing a smooth curve graph is relatively easy considered to the line of best fit. You just have to make sure your curve is smooth and connects all the dots together. There is another graph known as the best-fit curve. It is almost the same as the line of best fit just that it is curved. You can use a flexi ruler to help you out. Here is an example of a smooth curve graph:
When we draw graphs, we also have to understand something called the axis.
What is an axis?
An axis is a "a fixed reference line for the measurement of coordinates."
There are two types of axes, the horizontal and the vertical. It is known as the x and y axis respectively.
The x axis is the independent variable whereas the y axis is the dependent variable.
"the variable that is thought of as a cause is placed on the horizontal axis, and the variable that is thought of as an effect on the vertical axis".
What are variables?
A variable is "a quantity which during a calculation is assumed to vary or be capable of varying in value."
What is Interpolation and Extrapolation?
INTERPOLATION is a method used to approximate values that are in between points of a graph.
EXTRAPOLATION is a method for approximating values that are beyond the range of the data. Data must be extrapolated when values needed are not in the range of the measurements obtained.
Well, a graph is supposed to show the relationship between variable quantities on the x and y axis. Now you know if you've drawn a good graph!
References from Google, Wikipedia and Youtube.
Thank you for reading!


No comments:
Post a Comment